
Bitcoin trading isn’t for everyone. Unlike the stock market, the crypto marketplace is open 24/7/365. This means that if you’re an emotional trader, you’ll never be “off.” Instead, you’ll worry about your investments all day, every day. Furthermore, bitcoin is volatile. So, if you’re not prepared to lose everything you put into it, then you are in the wrong market. Bitcoin trading is a high-risk activity. If your risk tolerance is low, then you will do better with more conservative investments. If on the other hand, you are excited about blockchain technology, or if you want to get away from storing all of your wealth in the form of fiat currency, then the bitcoin market may be perfect for you.
Study Bitcoin History
Spend some time and review a chart that shows historical data on bitcoin trading over time. Look for seasonal trends, and also look for major events. A good place to start is TradingView.
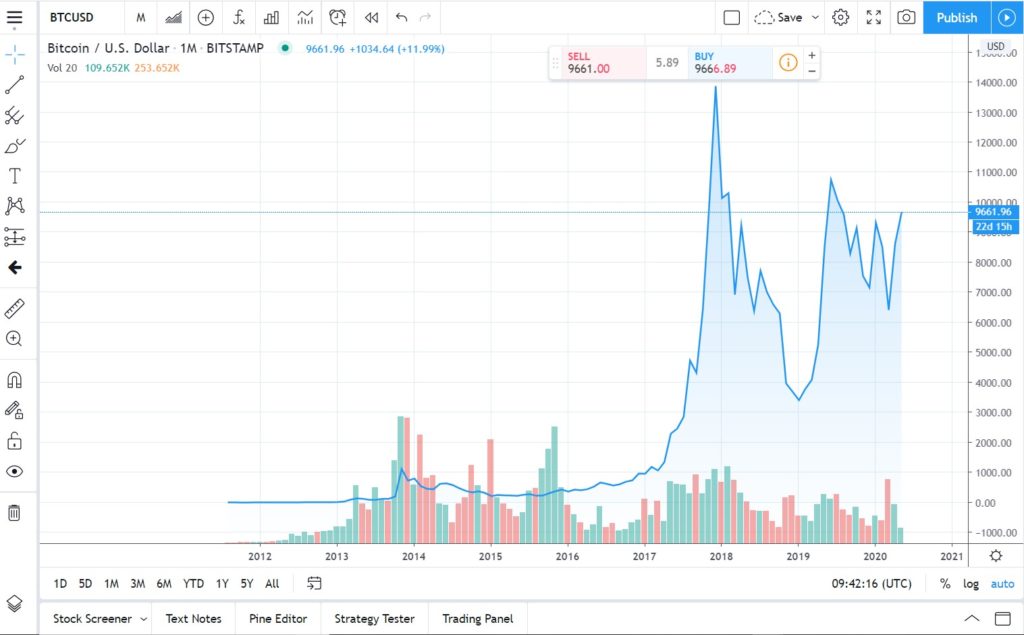
In the above chart, you’ll notice several things. First, the line graph displays the BTC price over time. Note that there is some variance across trading platforms. For example, the price of bitcoin on Coinbase will be slightly different than the price on Gemini. However, you can get a feel for trading direction from any chart.
Next, look at the green and red bars. These represent trading volume. The taller the bar, the more people traded BTC during that period. If the bar is red, it means that the bitcoin supply was greater than the demand. Or generally, more people wanted to sell during that period than those who wanted to buy. If the bar is green, then it means the opposite. People were generally looking to buy bitcoin during that period. Play with different time-frames and you’ll start to see patterns emerge.
What is a Candlestick and What Does it Tell You?
A candlestick (sometimes abbreviated, candle) is a visual representation of the high, low, open, and closing prices of a crypto or a security, for a specific time frame. Investors use them in their technical analysis of a crypto’s historic price movements. Some candlestick patterns are interpreted to predict major changes.

How to Read Candlesticks
Eventually you will develop the ability to read patterns in charts. But before you get to that point, it’s important to learn how to read candlesticks. You’ll recognize levels of bullishness, which will inform your trades. Consider the following candlestick chart:
